Centralised Monitoring Solution
This document describes the architecture of the centralised monitoring platform used across all GCP projects. The solution provides unified logging, metrics collection, visualization, alerting, authentication, and backup capabilities.
::: tip Objectives
- Centralise application logs and infrastructure metrics
- Provide real-time monitoring dashboards
- Generate alerts for operational issues
- Secure access using role-based authentication
- Maintain backup and disaster recovery capabilities
:::
Architecture Overview
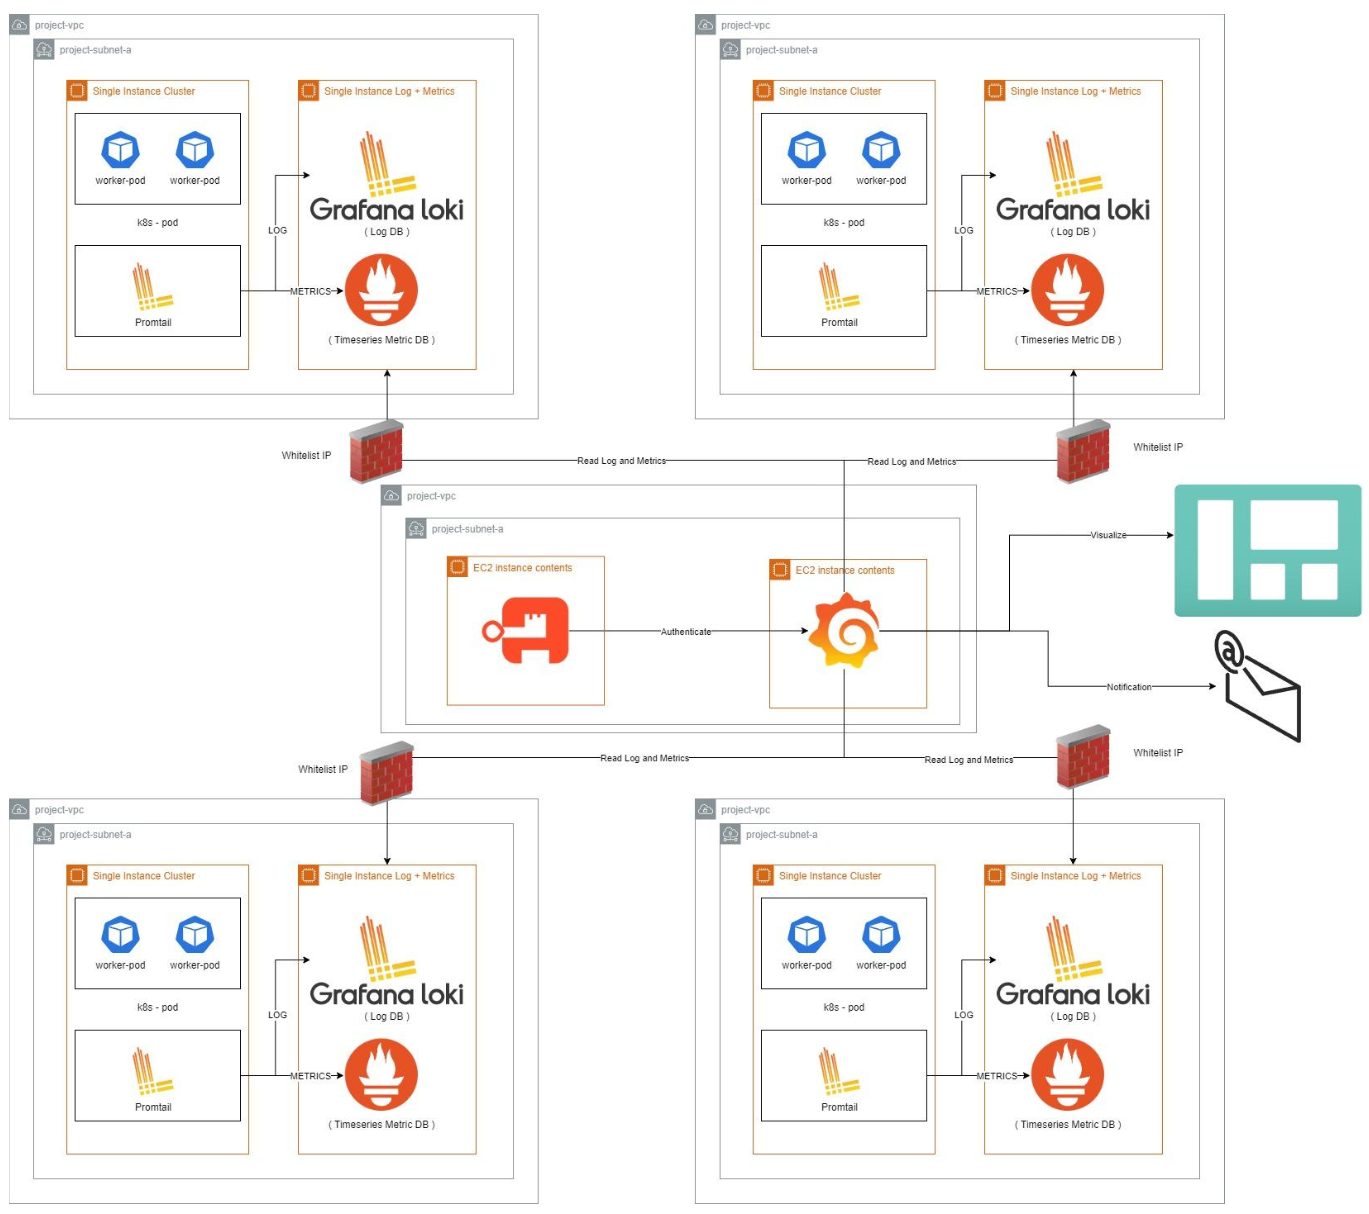
flowchart LR

subgraph GCP_Project["GCP Project"]

Server1["Application Server"]
Server2["Application Server"]

Promtail["Promtail"]

Loki["Grafana Loki"]
Prometheus["Prometheus"]

Server1 --> Promtail
Server2 --> Promtail

Promtail --> Loki
Promtail --> Prometheus

end

Grafana["Grafana"]

Authentik["Authentik"]

Grafana --> Loki
Grafana --> Prometheus

Authentik --> Grafana
Components
| Component | Purpose |
|---|---|
| Grafana Loki | Centralised log storage |
| Prometheus | Metrics collection and storage |
| Promtail | Log aggregation agent installed on application servers |
| Grafana | Dashboard visualization and alerting |
| Authentik | Authentication and role-based access management |
Log & Metrics Collection
Each GCP project hosts its own monitoring stack.
Infrastructure
For every project:
- One Grafana Loki instance for log storage
- One Prometheus instance for metrics collection
For every server instance:
- One Promtail agent responsible for collecting logs
flowchart LR

Application["Application"]
Logs["Application Logs"]

Logs --> Promtail
Promtail --> Loki

Application --> Prometheus
Monitoring Metrics
The following metrics should be collected for every application.
| Metric | Description |
|---|---|
| CPU Usage | Processor utilization |
| Memory Usage | RAM consumption |
| Disk Usage | Storage utilization |
| Incoming Requests | Request throughput |
| Outgoing Requests | External/API traffic |
These metrics provide baseline visibility into application health and infrastructure performance.
Dashboard & Visualisation
Grafana is used as the central monitoring dashboard.
Features include:
- Infrastructure dashboards
- Application dashboards
- Log exploration
- Metrics visualization
- Historical performance analysis
flowchart LR

Loki --> Grafana
Prometheus --> Grafana

Grafana --> Dashboard["Dashboards"]
Grafana --> Explore["Log Explorer"]
Grafana --> Metrics["Metrics"]
Alerting
Grafana Alerting monitors both logs and metrics.
Alerts can be configured for conditions such as:
- High CPU utilization
- High memory usage
- Disk capacity thresholds
- Application downtime
- Error rate spikes
- Service availability issues
flowchart LR

Prometheus --> Grafana
Loki --> Grafana

Grafana --> Alert["Alert Rules"]

Alert --> Email
Alert --> Slack
Alert --> Teams
Authentication & Access Control
Authentication is managed through Authentik.
Features
- Single Sign-On (SSO)
- Centralised authentication
- Role-Based Access Control (RBAC)
Roles determine permissions for:
- Grafana dashboards
- Project applications
- CLI execution
- Administrative functions
flowchart LR

User --> Authentik

Authentik --> Grafana

Grafana --> Admin
Grafana --> Developer
Grafana --> Viewer
Security
To minimise exposure:
- Application servers are not publicly accessible.
- Only the Grafana server is allowed to access monitoring endpoints.
- Access is restricted through IP whitelisting.
- Authentication is enforced through Authentik.
flowchart LR

Internet -. Blocked .-> Application

Grafana --> Application

style Grafana fill:#4CAF50
style Application fill:#2196F3
Backup Strategy
Production monitoring data should be backed up regularly.
Recommended approach:
- Database snapshots
- Scheduled backups
- Backup retention policy
- Recovery validation
| Environment | Backup Strategy |
|---|---|
| Development | Optional |
| Staging | Optional |
| Production | Scheduled database snapshots |
Technology Stack
| Technology | Purpose |
|---|---|
| Grafana | Monitoring Dashboard |
| Grafana Loki | Log Database |
| Prometheus | Metrics Database |
| Promtail | Log Collector |
| Authentik | Authentication & RBAC |
| GCP | Infrastructure Platform |
Summary
The Centralised Monitoring Solution provides a unified platform for monitoring applications and infrastructure across multiple GCP projects.
Key capabilities include:
- 📊 Centralised dashboards
- 📈 Infrastructure and application metrics
- 📜 Centralised log management
- 🚨 Real-time alerting
- 🔐 Secure authentication with Authentik
- 💾 Production backup strategy
- ☁️ Scalable monitoring architecture